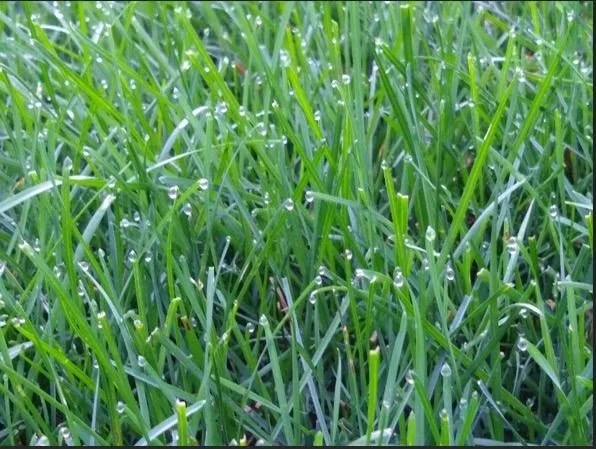
What better place to start the process of introducing third graders to weather data than with the formation of dew?
Dew formation is the result of one of the most important processes in weather: condensation. When air becomes saturated with water vapor, that is, when relative humidity reaches 100 percent, condensation will occur. The temperature at which this happens is called the air’s dewpoint temperature. At ground level this is associated with the formation, often overnight, of dew and fog. At higher altitudes it is associated with the formation of clouds.
Meteograms in the classroom
In this webinar participants are introduced to meteograms created by the Wyoming Weather Web, associated with the University of Wyoming Department of Atmospheric Science, and by the American Meteorological Society. One of the meteograms used shows how, when air temperature and dewpoint temperature coincide, fog will form.
Data your students can graph
What is even more amazing is that this data can be easily downloaded into a form that teachers can understand and make available to their students for the creation of graphs and other data visualization tools. Teachers learn where and how to access the data, how to interpret the key variables, and how to prepare simpler, smaller datasets that third graders can work with.