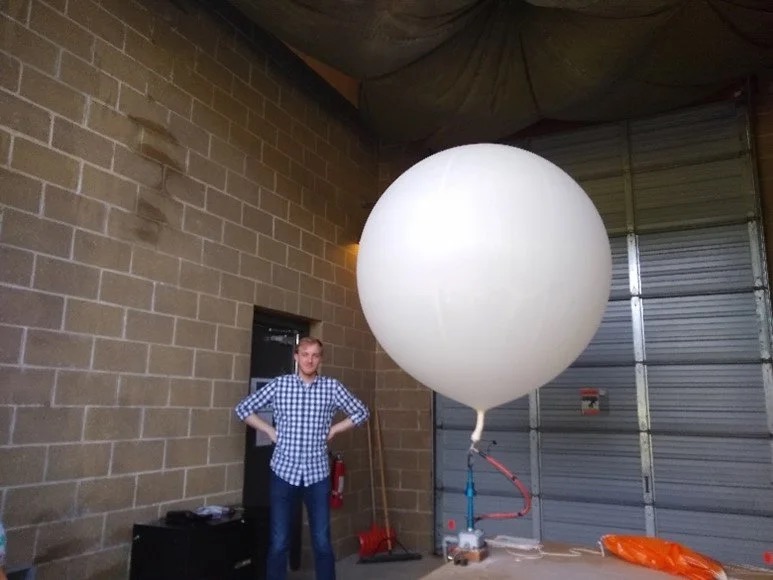
Many people are aware that weather data is collected at weather stations across the U.S. Fewer people know that data is also collected in the upper atmosphere by weather balloons, or radiosondes, like the one shown above.
Such data provides an important cross-section of our atmosphere at a particular point in time. With the press of a few keys, one can see what the air temperature, relative humidity, atmospheric pressure and wind direction and speed are at several different altitudes, going as high as over 100,000 feet.
Why scientists care
This data helps scientists identify things such as wind shear, which can contribute to the development of severe weather like tornadoes, and document atmospheric inversions that contribute to poor air quality at other times of the year.
Data your students can graph
What is even more amazing is that this data can be easily downloaded into a form that teachers can understand and make available to their students for the creation of graphs and other data visualization tools. In this webinar teachers learn where and how to access the data, how to interpret key variables, and how to prepare simpler, smaller datasets their students can use to make graphs.
It also provides a wonderful opportunity for students to learn about several important aspects of the nature and practice of science: how observations are made, how instruments work, and how data becomes evidence.